
Distribution throughout the cycle
With xpertSea MAX, the distribution of a sample can be summarized into a single number. But, how can you know if that number is desirable? This is where xpertSea has additional artificial intelligence to help.
Variation of Distribution
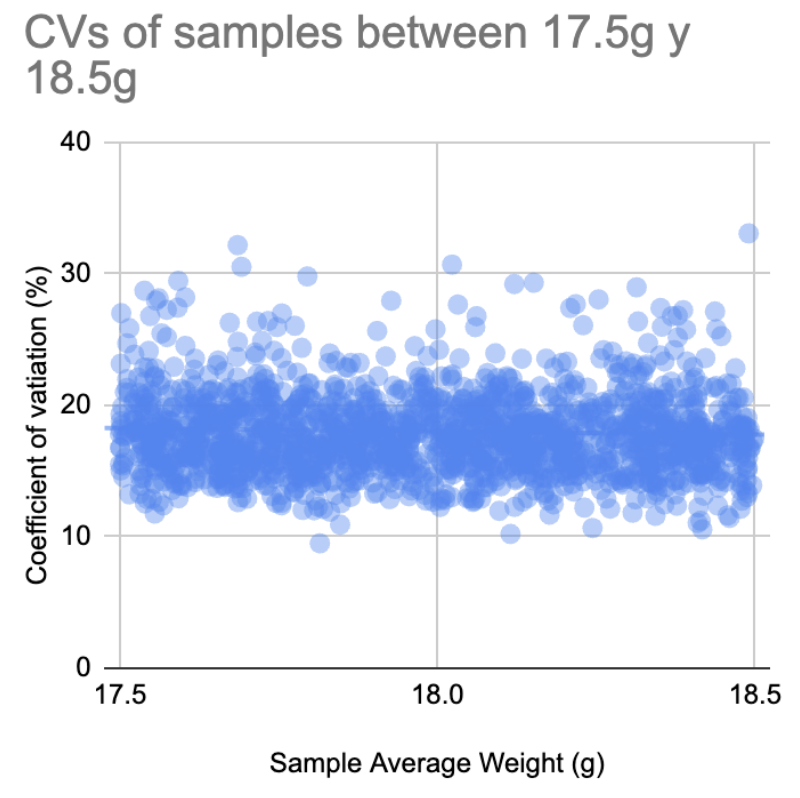
The number that summarizes distribution is called the CV. Throughout a cycle, this number gradually gets lower, and therefore the identification of highly distributed shrimp can be quite difficult to detect with only the CV. Looking at many samples of a small weight range, it can be seen that there is a high variation of CV. Between 17.5g and 18.5g, there are CV values of <10% and >30%.
Identification of good distribution
Using a dataset of more than 4.5 million images of shrimp, we have developed a model which identifies the range of good distribution at every weight.

On top of this, by monitoring throughout the whole cycle the trend of distribution can be observed. When the CV begins to rise partway through the cycle, it is indicative of a problem in the pond. This could be related to a change in the feeding regime and shrimp feeding unevenly, the pond could be reaching its carrying capacity and needs either more aeration or a partial harvest, or there could be problems related to the water quality in the pond.
While ensuring a small distribution is critical, a pond with a good distribution early in the cycle can still face problems later in the cycle. By monitoring and tracking the distribution regularly throughout the cycle, problems can be identified earlier and resolved or prevented altogether.
Using xpertSea MAX to track distribution throughout the cycle reduces risk and leads to a more profitable production.For more information or to bring xpertSea MAX onto your farm, please contact us at info@xpertsea.com.