
Impact of an asymmetric distribution of weights
In the Why is Distribution Important and How to Manage it article, we talked about the various components of a weight distribution and why they are important. Here, we will take a deep dive into one of them: symmetry.
Why is Symmetry Important
Symmetry of the weight histogram is critical to pay attention to as it impacts the classification of the shrimp at processing time by 3 to 7 cents / lb, and can increase your FCR. Having an asymmetric distribution that leans “left” means more of the animals are to the left of the average weight, and therefore are more likely to be classified as a smaller size, yielding less money.
Analysis
In our analysis, we wanted to compare what a harvest would be for a pond that was left as is, versus how it would have been harvested if the skew was corrected earlier in the cycle. There were several variables that needed to be considered.
First off, while there are various ways to quantify symmetry, we decided to use a simple and easy to understand measure, and that was the percentage of animals that are below the average body weight.
1.Quantify Symmetry
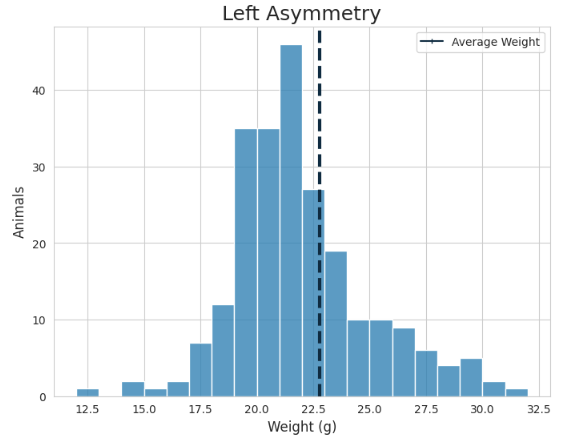
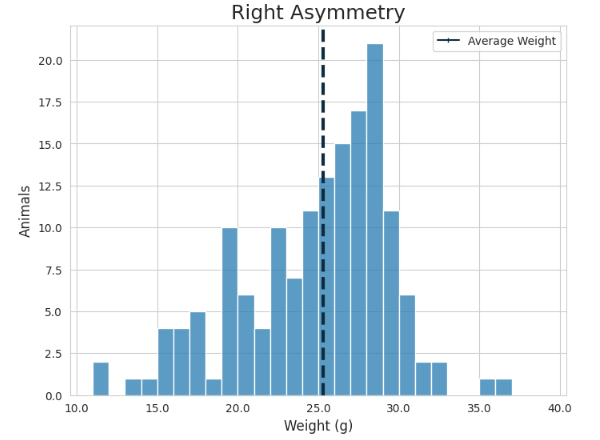
The symmetry can be quantified using xpertSea’s computer vision, and shows up in the weight histogram. This can be clearly seen in the images below. It can be clearly seen the difference between an asymmetric distribution that is left leaning (where a large percentage of animals are below the average weight) in the left image vs. a right leaning asymmetry in the right image, where the opposite is true.
2. Correct Asymmetry
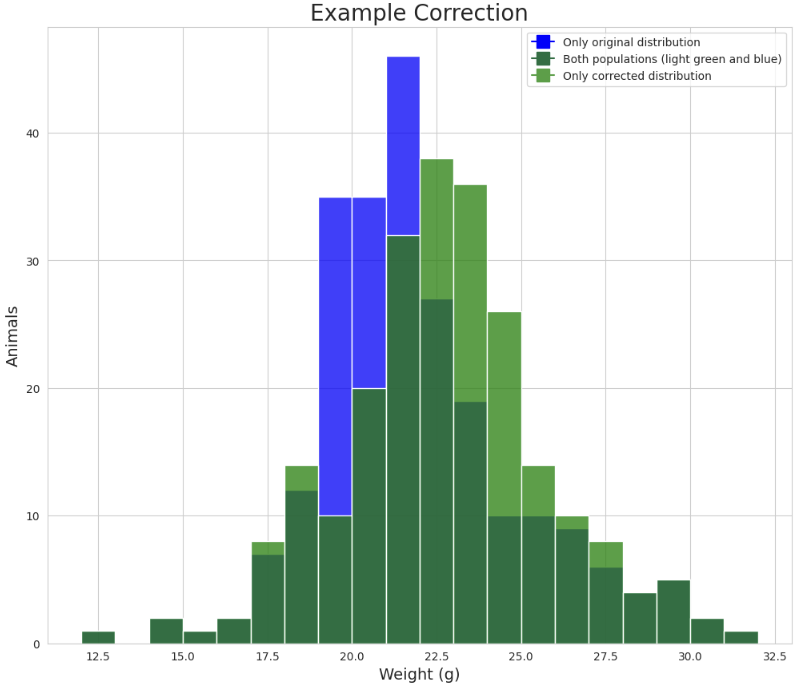
We developed a method to resolve the asymmetry to determine what the harvest would be if skew had been resolved in the prior weeks. This was completed using standard statistical tools. The image on the left shows an example of what the original sample was (blue) and what the sample looks like after correction (light green). Areas in dark green represent both distributions. This meant if there is was a sample with left leaning asymmetry, we adjusted it to be symmetrical.

3. Define Price List
Next, to get the impact on $/lb we had to pick a price list to use. We used a price list that shows an estimate of what the farm gate prices were in Ecuador in June, 2023.
4. Gather data
Lastly, we had to collect the data to be used in the analysis. We looked at just over 2,200 samples with an average weight range between 18-23g, all from xpertSea MAX monitorings.
Results
After the approach for the analysis was finalized, the analysis was completed. By correcting asymmetry, we were able to see a clear trend of the animals being classified in higher sizes and therefore increasing the $/lb revenue for the farm.

For example, if there are 57% of animals below the average body weight, this results in a -4¢ / lb difference in price at harvest.
We were able to get the exact formula for this trend and incorporate it into xpertSea MAX. Using xpertSea MAX, you will receive this insight as well as recommendations on how to resolve issues with symmetry each monitoring, ensuring you are harvesting more profitably.
To learn more about this or to bring xpertSea MAX to your farm, contact us at info@xpertsea.com.